
Stock Price Alert Display: Levels, Halts and Crosses
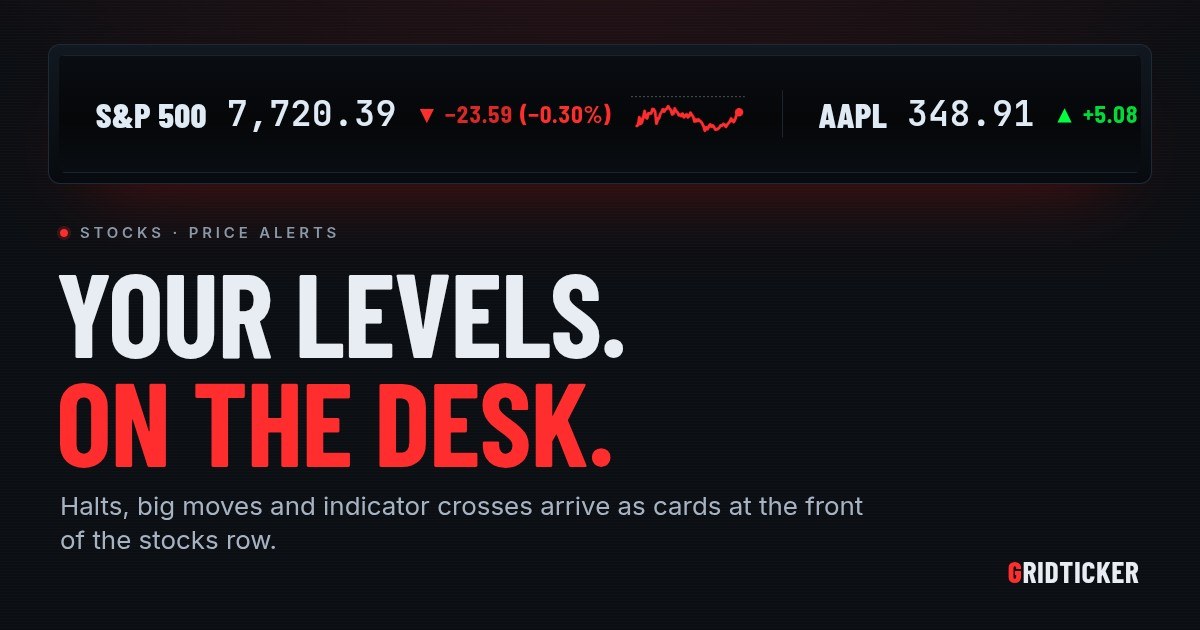
A stock price alert display is a screen beside your work that shows you when something happens to a stock you follow. That could be a price you picked being crossed, a trading halt, a big move on the day, or a moving average, RSI or MACD signal. GridTicker runs in a browser on a spare monitor or a TV, and its stock alerts are cards at the front of the stocks row. Each card names the symbol, the price, the day's move, what happened and how long ago. You never have to dismiss one. Each card stays up for a set time, then goes.
This article covers what each kind of alert watches for, the technical indicators you can track, how long each card stays up and how to set rules for one symbol.
Why put alerts on a screen
A phone notification is easy to swipe away before you've really read it. Once it's gone, nothing reminds you a level was crossed an hour ago. A screen at the edge of your desk keeps the alert where a glance will catch it.
GridTicker's alerts are "worked out fresh from the day's prices on every refresh, so there is nothing to dismiss." A card stays up for its set time, so you can still see a halt that started while you were in a meeting when you get back.
What an alert card looks like
An alert is a card of its own at the front of the stocks row. Its box is color-coded:
- Green for a move up
- Red for a move down
- Orange for a trading halt
- The highlight color for a price level you set yourself
The card names the symbol, the price and the day's move. Then it says in a line what happened, such as "Rose above 250.00, your Sell level", "4.2× the last hour's volume" or "Trading halted: news pending", and how long ago it happened. Cards for your own levels and for halts pulse their frame. The rest sit still, so the two you most need to see stand out.
The kinds of alerts
You turn these on for every symbol at once, under For every symbol. One symbol can have its own set instead (more on that below).
Your own price levels
A level is a price plus a direction: alert me when the stock rises above it, or when it falls below it. You can add a label such as Buy, Sell or Stop. A level alert stays up for two hours after the crossing, and crossing back the other way is a new alert.
Halts and resumptions
This alert fires when an exchange stops trading in a stock and again when trading starts back up. The card gives the exchange's reason, such as news pending, a volatility pause or a regulatory concern. Halts come from the exchanges' own halt list, which covers every US listing. A halt card stays up for as long as the halt lasts.
Big moves, sudden moves and unusual volume
- Big move today: the price is up or down at least your chosen percent since yesterday's close. The default is 3%. The card stays up as long as the move holds.
- Sudden move: the price moves at least your chosen percent within 15 minutes. The default is 2%. The card stays up for an hour.
- Unusual volume: five minutes of trading at least your chosen multiple of the last hour's pace (3× by default), and well above the stock's normal five minutes. There are no volume alerts in the first half hour of the session, which is always busy, or in its last ten minutes, during the closing auction.
52-week highs and lows
This fires when the price trades above its highest price of the past year, or below its lowest.
The indicators traders watch
Indicators are the technical levels traders follow. Each one is worked out from a year of daily prices and tracked like a level of your own. When the price crosses one, in either direction, you get an alert. The list starts with the 50-day and 200-day moving averages. You can add any of these, with your own numbers:
- Moving average (SMA) and exponential average (EMA) of any period from 2 to 250 days.
- Bollinger bands: a 20-day average and two standard deviations unless you change them. The alert fires when the price closes outside the band.
- RSI: overbought above 70 and oversold below 30, over 14 days.
- MACD: the 12/26 line crossing its 9-day signal line, which is a bullish or bearish cross.
- VWAP: the price crossing the day's volume-weighted average.
- Pivot points: yesterday's classic pivot and the resistance and support levels around it (P, R1-R3, S1-S3). Tick the ones you want.
- Yesterday's high and low: the price breaking above one or below the other.
- Fibonacci retracement: the 23.6, 38.2, 50, 61.8 and 78.6 percent levels of the last month's, three months', six months' or year's range, or of a high and low you type in.
How long each alert stays up
| Alert | How long it stays up |
|---|---|
| A crossed level or indicator | Two hours |
| A 52-week high | Eight hours |
| A sudden move | One hour |
| A VWAP crossing | One hour |
| A volume surge | Half an hour |
| An RSI or MACD signal | While it holds |
| A big move on the day | While it holds |
| A trading halt | As long as it lasts |
Rules for a single symbol
The Per symbol list opens each of your symbols to its own settings. Each one can have:
- Its own price levels, up to six for each symbol
- Its own alerts and indicators, with its own numbers, in place of the account-wide ones
So one stock can track a 21-day EMA and the three-month retracement while the rest use the plain moving averages. Up to 40 symbols can have their own rules, and a symbol keeps its rules when you take it off your watchlist.
You can also get the alerts without the quotes. If the Stock alerts source is on for a screen and My watchlist is off, your watchlist's symbols are still watched for alerts, but their quotes don't scroll. That covers "tell me when NVDA reaches 150" without anything else about NVDA all day.
Where the prices come from
Everything is worked out from the day's five-minute prices the ticker already has. You don't need an account with any exchange, and the same crossing shows the same way on every screen. Prices come from Yahoo Finance and can run a minute behind the exchange. A halt appears within a minute of the exchange posting it.
How GridTicker works as a stock alert display
GridTicker runs in any modern browser on Windows, macOS, Linux or a Raspberry Pi, with nothing to install. It fits the space it's given, from a bar across the top of a monitor to a whole screen.
To set it up:
- Build your watchlist under Settings → Stocks. You can add symbols like AAPL, an index like ^GSPC, a future like GC=F, or BTC-USD, up to 20 in all. See Favorites.
- Choose your alerts and indicators under Settings → Stocks → Stock alerts. The settings are explained in Stock alerts, and how a card reads is in Stocks.
- Pick a screen. Each ticker can be on for some screens and off for others, so stocks can go on the desk and sports on the wall. See Where each ticker appears.
- Set the hours. A schedule can keep stocks on screen only while the market is open. See When each ticker appears.
Alongside the alerts, the stocks row shows each symbol's price, its change since yesterday's close and a line of today's trading. When a stock has moved sharply and there's a story about it from the last few hours, the story shows beside the price under BREAKING.
To try it on your own symbols, set up a strip at https://app.gridticker.com/signup.